Asset prices contain enormous amounts of information. This information is typically characterised as being both forward-looking and related to the economy – money-weighted investor expectations about future company earnings, defaults, inflation, monetary and fiscal policy. And, in our opinion, this is almost right. Asset prices consist largely of forward-looking expectations, but they also contain information about the current state of the financial system itself.
Understanding this information and taking a view on the robustness (or otherwise) of the financial system itself can – during periods of stress – be just as important as understanding the forward-looking information when making investment decisions. It can help explain asset price movements and prevent investors from misapplying fundamental views about the economy to investment decisions.
During the first phase of Covid-19-driven markets the state of the financial system has been a big driver of risk asset prices. In this piece we discuss how we have understood the impact of market disorder on valuations and responded during this first phase.
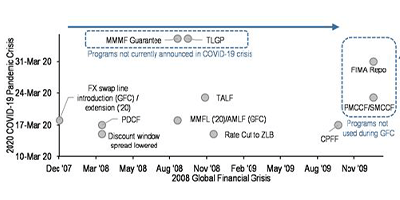
Over the course of March, the global economy came to a sudden stop as governments sought to put much of their countries’ economic structures into suspended animation. The financial system began to fall apart: transaction volumes collapsed, firms hoarded cash and lending ceased. Figure 1 shows that, despite central banks cutting policy interest rates, the rate at which banks could borrow soared and the volumes of money that they could borrow collapsed. It was only the exceptionally swift and massive response on the part of central banks that prevented system-wide failure. Figure 2 shows how policy responses that took quarters to deploy during the Global Financial Crisis (GFC) were rolled out in days. And new policies, such as the Federal Reserve’s Primary and Secondary Market Corporate Credit Facilities, that had never been deployed were added to the mix.
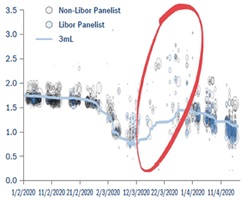
Figure 2: announcement date of us fed programmes/actions during the 2008 gfc vs the current 2020 covid-19 pandemic crisis
Source: JP Morgan US Fixed Income Markets Weekly, 4 April 2020 and 17 April 2020. Left-hand chart sized by issuance, rate (%); 3m Libor (%). In the right-hand chart, arrows indicate the forward flow of time.
Functioning credit markets are crucial to both the real economy and to investors across all asset classes. They allow creditworthy firms to borrow money to pay salaries, fund capital expenditures, and service past debts. The price at which these fixed-term borrowings are originated and change hands in the secondary market informs the valuation of other long-dated cash flows like rents and future earnings. Rising corporate bond yields are consistent with a fall in the future value of all future corporate cash flows: they are a profoundly deflationary force for asset prices.
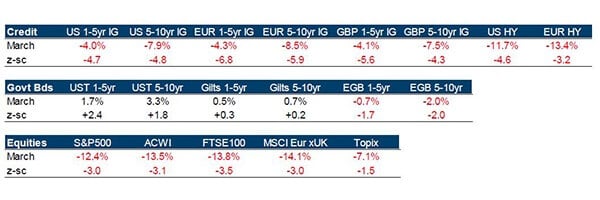
During March credit spreads widened substantially, pushing credit returns negative, while equity markets plummeted. Figure 3 shows asset class total returns for the month and standardises them as “z-scores” to show how large or small these moves were compared to the past twenty years – and as such includes the GFC. For reference, a z-score of two is something that could be expected to occur a couple of times every three years or so and a z-score of three might happen once a decade. Figure 3 highlights how the magnitude of returns seen in short-dated credit markets, while modestly negative in total return terms, were unusually significant. This was symptomatic of frozen and distressed funding markets.
How much of the jump in corporate bond yields was associated with an informed rise in investor expectations of the future (deteriorating economic conditions, worsening credit metrics and rising default rates), and how much was associated with contemporaneous systemic financial market distress that central banks have sought to offset?
We can get some quantitative insight into the contemporaneous damage to market functioning by looking at the ETF market. Exchange-traded funds can be convenient vehicles for investors to use in normal market conditions, but during periods of market stress they may punish investors heavily for seeking to move money into or out of a market: ETF prices and published net asset values depart from one another substantially. Our research has found that the cost inflicted upon ETF investors seeking to move their assets (the disconnect between price and NAV) fits well with more sophisticated but lower-frequency measures that we maintain to price liquidity risk and so can serve as a pocket guide to liquidity proxy.
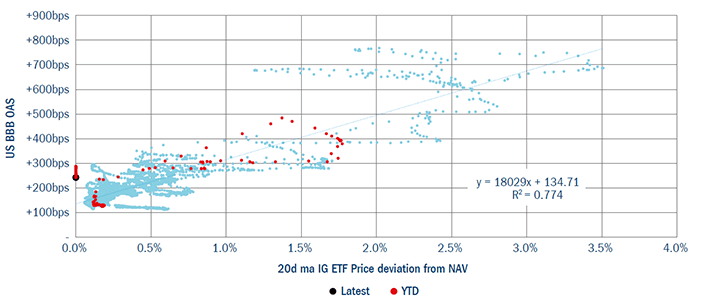
In Figure 4 we show the average absolute price deviation from NAV for the three largest corporate bond fund ETFs since 2006 and the level of triple-B rated US corporate bond market spreads over government bonds. The degree to which liquidity vanished from the market in March 2020 can be seen clearly. Figure 5 shows how the spread level and price deviation from NAV have been historically related: loosely but positively. During periods of market dysfunction, spreads move to elevated levels. During the year after the GFC liquidity was poor and credit risk premia was substantial. We believe that this substantial credit risk premia was meaningfully linked to market scarring left by the GFC, and this qualitative view corresponds to the quantitative measure that our ETF pocket guide signals.
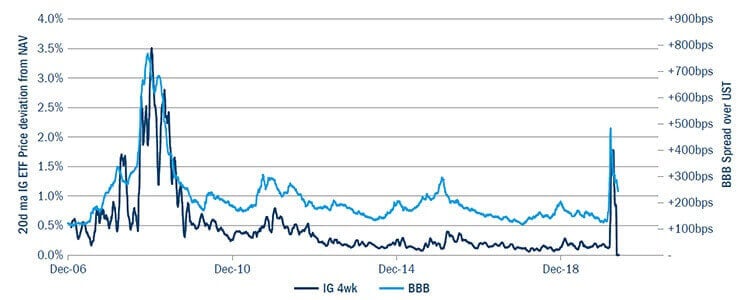
Source: Columbia Threadneedle Investments, Bloomberg 15 May 2020.
Figure 5: ICE BofA BBB US Corporate Bond Index option-adjusted spread vs 20 day moving average price deviation from Net Asset Value of three largest US corporate bond ETFs, 2007-2020.
This quick quantitative measure of elevated illiquidity risk premia corresponds with our more qualitative view that investment-grade credit modestly overcompensates investors for the economic risks ahead – substantial though they are. Our asset allocation decisions have been informed by these insights: for clients with a medium-term horizon we increased the quantity of risky assets in portfolios during the market mayhem, but have increasingly focused portfolios towards higher quality risky assets like investment-grade credit.
Smaller companies tend to be (although not always are) more cyclically sensitive. And concerns coming from the Columbia Threadneedle Investments economics team around the length and depth of the downturn – somewhat more cautious than most economic forecasters – makes building substantial positions in cyclically-sensitive areas of the market less obvious. Instead, we used the insight around aggregate risk premia for investors with medium-term horizons to build up quality-growth regional equity allocations in portfolios. And as liquidity premia retreated in credit markets, so valuations across other markets recovered.
The challenge as to how to synthesise a collapse in forward-looking expectations regarding economic activity with an appreciation of the huge boost to policy support is one that faces all investors, and one that we will return to in future viewpoints. But understanding how contemporaneous market risks flow into starting valuations also helps identify strong risk-adjusted return opportunities.